

The ROI of Automation in Manufacturing:
Real Cost and Payback Benchmarks by Use Case


Search “ROI of automation” right now and almost everything you get back is about software. Test automation. Marketing automation. RPA for invoicing. Useful, if you’re trying to justify a QA tool subscription. Not remotely useful if you’re trying to justify a seven-figure line upgrade to a finance director who wants a real number, not a SaaS vendor’s calculator.
That gap is the point of this post. Manufacturing automation the physical kind, robots and sensors and vision systems on an actual factory floor pays back on a completely different logic than software does. The inputs are different, the failure costs are different, and the benchmarks that matter are specific to what the automation is actually doing. Here’s what the real numbers look like, use case by use case, so you can walk into that budget meeting with something better than a vendor’s slide deck.

“The smart manufacturing journey is still emerging, but its value is undeniable… organizations that have already invested in smart manufacturing solutions will likely have an advantage those who haven’t, may not be able to defer much longer.” Tim Gaus, Smart Manufacturing business leader and principal, Deloitte Consulting LLP
What the ROI of Automation Actually Means on a Factory Floor
The ROI of automation, on a real production line, comes down to one comparison: what you spend on the system, against what you stop losing because of it. That sounds simple. It isn’t, because the “what you stop losing” side is where most business cases fall apart teams either can’t quantify it, or they quantify it so vaguely that finance doesn’t believe the number.
The fix is picking a failure mode you can actually measure. Unplanned downtime, missed defects, product returns, labor cost on a line you’re trying to reshore these are all countable. “Improved efficiency” is not. If your ROI case leans on a soft claim like that, it’s not a business case yet, it’s a hope. It’s also worth saying plainly: a good ROI case is boring. It’s a number pulled from your own maintenance logs, not a vendor’s confidence.
92% of executives say smart manufacturing will be the main driver of competitiveness over the next three years.
Why Generic Automation ROI Numbers Don’t Apply to You
Here’s the honest reason most “automation ROI” content online is useless for a manufacturer: it’s written by and for software companies, because that’s where the search volume and the marketing budgets are. A test-automation vendor’s ROI calculator assumes your bottleneck is engineer-hours. Yours is machine-hours, scrap rate, and the cost of a product that fails in the field instead of on the line.
Two things happen when you plug factory-floor economics into a framework built for software. You underestimate your case, because the calculator has no field for “cost of a recall.” Or you overestimate it, because it ignores integration time, floor disruption, and the fact that a robot doesn’t ship a bug fix it needs a technician. Use benchmarks built for your actual failure modes, not adapted ones.
“Unplanned downtime costs US manufacturing an estimated $50 billion every year… in high-cost sectors like automotive and oil & gas, payback in 3–6 months is common.” – TEEPTRAK’s 2026 report
The ROI of Automation, Benchmarked by Use Case
None of the ranges below are theoretical. They’re what’s being reported across current deployments and they vary sharply, because “automation” isn’t one purchase, it’s five or six different ones with different payback logic. This is the part a generic ROI calculator can’t give you, because it doesn’t know which of these you’re actually buying.
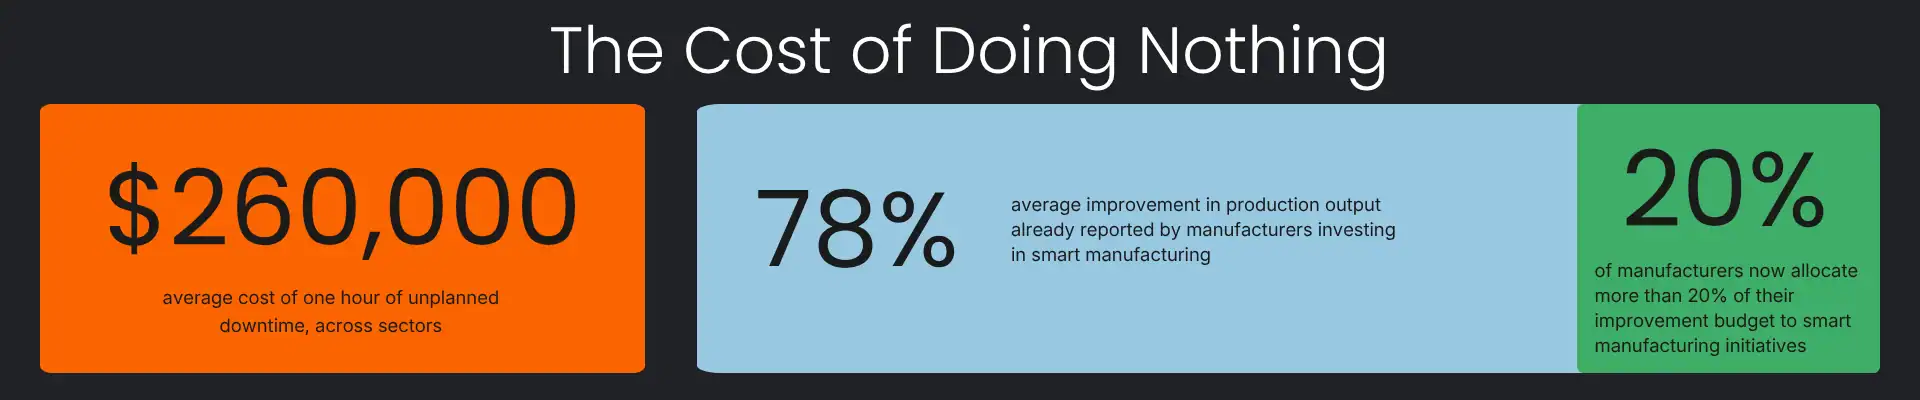
Predictive maintenance. This is the cleanest business case on this list, because the comparison is direct: the cost of the sensors and monitoring versus the cost of the downtime they prevent. Reported results show 30–50% reductions in unplanned downtime and 18–25% lower maintenance costs. That matters more than it sounds, because unplanned downtime in manufacturing runs to roughly $260,000 an hour on average across sectors so even a partial reduction pays for a monitoring system fast, especially on equipment that’s expensive or slow to replace.

Quality pioneer Armand V. Feigenbaum, who coined the concept of the “hidden factory” in the 1970s, described it as “that part of your organization that exists to do bad work”
Automated product testing. For manufacturers we’ve worked with, automated testing and robustness analysis has helped cut costs associated with product returns by up to 25%, by catching failure patterns before a product ships rather than after a customer finds them. This is the use case most likely to get skipped in a budget conversation, because a returns problem feels like a customer service line item rather than an automation opportunity but the math works the same way as downtime: prevention is cheaper than the failure it prevents, once the failure is expensive enough.
Vision-guided inspection. AI-driven inspection systems are reporting accuracy in the 95–99% range under real production conditions, against roughly 70–82% for manual or standard rules-based inspection. The ROI case here depends almost entirely on the cost of what gets missed: on a low-consequence product, that gap doesn’t justify the spend. On tight-tolerance consumer electronics or medical devices, where a missed defect means a recall rather than a return, it usually does.

AI-driven quality systems deliver 374% average three-year ROI with a 7–8 month average payback. (Forrester Consulting
Autonomous mobile robots. AMRs are the slowest-burn case on this list and the most mature this is a market growing from roughly $2.75 billion in 2026 to $7.07 billion by 2032, a sign of how proven the payback already is at scale. The ROI logic here is less about failure prevented and more about labor cost and floor flexibility recovered: fewer fixed conveyors to reconfigure every time your product mix shifts.
Adaptive robotic assembly. This is the widest range of maturity on this list, and honestly the hardest to benchmark cleanly, because “adaptive” covers everything from genuinely production-ready cobots to advanced pilots still finding their footing. Don’t take a vendor’s payback number here at face value ask for a demonstration on your parts before you put a figure in a spreadsheet.

Predictive maintenance delivers 10–30x ROI within 12–18 months, with 95% of implementers reporting positive returns.
How to Calculate Your Own Number
Skip the generic calculator. Use this instead:
Step one: pick one failure mode. Downtime, defects, returns, or labor cost. Pick whichever is the single biggest line item on your P&L right now not the one that sounds most technically interesting.
Step two: get a real cost for it. Not an estimate from memory pull the number from maintenance logs, quality data, or finance. If you can’t get a real number, that’s worth noting on its own: it usually means nobody’s been tracking the cost of the problem you’re about to spend money solving.
Step three: get a bounded pilot quote, not a full rollout quote. A single line or workstation, priced separately from a facility-wide deployment. This gives you a real payback period on a small number, instead of a speculative one on a large number.
Step four: divide pilot cost by annual savings. That’s your payback period in months. If it’s under twelve, you have a strong case. Eighteen to twenty-four months is still defensible for high-value equipment. Beyond that, the case needs a second look either the failure cost is smaller than it seemed, or the system is priced for a bigger problem than the one you have.

What Slows Payback Down
The numbers above assume the project goes reasonably well. Three things routinely push payback out further than the pitch promised.
Integration time gets underestimated. The automation hardware is rarely the hold-up ,fitting it into an existing line, ERP, and quality process is its own project, and it’s the part vendors mention least.
Maintenance capacity gets ignored. Physical AI systems in particular need more ongoing tuning than fixed automation. If that falls on a team that’s already stretched, the “savings” side of the equation shrinks quietly, month by month.
The pilot never happens. Skipping a bounded pilot and going straight to a full rollout is the single biggest way a strong benchmark turns into a disappointing actual result because the benchmark was measured somewhere else, on someone else’s parts.
Intretech works through this exact cost-benefit assessment with manufacturers before recommending anything, across consumer electronics, medical, and industrial production building and deploying automation lines live in under six months, with an average client ROI inside twelve. If you want a straight answer on what the payback actually looks like for your line, book a free consultation with our engineering team.

Operator-reported performance overstates real equipment effectiveness by 8–15 points compared with machine-measured data
Frequently Asked Questions
What counts as a good ROI for manufacturing automation?
A payback period under twelve months is a strong case; twelve to twenty-four months is still reasonable for expensive or high-value equipment. Beyond two years, revisit whether the failure cost you’re solving for is actually large enough to justify the system.
How long does it typically take for automation to pay for itself?
It depends heavily on the use case. Predictive maintenance and automated testing tend to pay back fastest because the costs they prevent — downtime, returns — are easy to measure. Adaptive assembly and vision-guided inspection usually take longer to prove out.
Does physical AI cost more than traditional automation?
Generally yes, per unit deployed. The premium is easiest to justify where variability or the cost of failure is high. On stable, high-volume, low-variation lines, traditional automation is usually still the better return.
Can you calculate ROI before installing anything?
Yes, and you should. Get a real cost figure for the specific failure you’re solving, then price a bounded pilot rather than a full rollout — that gives you a defensible payback estimate before you commit budget to the whole line.
What’s the biggest factor that slows down automation payback?
Skipping the pilot. Reported benchmarks are measured somewhere else, on someone else’s production line. Without a pilot on your own parts and your own conditions, you’re estimating your ROI from someone else’s factory.

65% of manufacturing executives rank operational/implementation risk as a top-two concern; 48% report moderate-to-significant staffing gaps in operations and maintenance roles; 35% cite workforce upskilling as a top concern. (Deloitte Smart Manufacturing and Operations Survey, 2025)
Explore more related content

USMCA Rules of Origin: A Practical Guide for Electronics OEMs (2026 Update)
USMCA Rules of Origin: A Practical Guide for Electronics OEMs (2026 Update) USMCA rules of origin used to be a...

Nearshoring vs Offshoring: How to Choose Your Manufacturing Footprint and EMS Partner
Nearshoring vs Offshoring: How to Choose Your Manufacturing Footprint and EMS PartnerNearshoring vs offshoring is...

Electronics Manufacturing in Mexico: A Buyer’s Guide to Nearshoring in 2026
Electronics Manufacturing in Mexico: A Buyer’s Guide to Nearshoring in 2026Electronics manufacturing in Mexico is no...